Flow Cytometry 

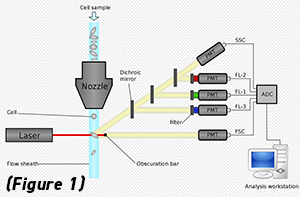
Flow cytometry is a well-established method often used by biologists and biomedical engineers to characterize individual cells that are suspended in solution. In conventional flow cytometry, these cells pass through a microchannel and are probed with a laser. The laser-cell interaction causes either photon-scattering (to get granularity and size) and/or photo-absorption and fluorescence emission (to detect molecular markers on the cells). Finally, data processing software takes the scattering and fluorescence signals and combines them such that important statistics can be garnered from the given population of cells. This technique has even been extended to cell sorting, where a heterogeneous mixture of cells can be rapidly sorted based on the individual scattering and fluorescence signal of each cell.   
(Figure 1: Illustration of flow cytometry. Image from Wiki.)
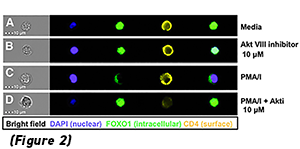
Image Cytometry

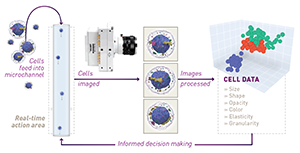
Image cytometry is similar to flow cytometry, but where images of the cells are acquired as they flow through a microchannel. This is done with two primary imaging modes: bright-field and fluorescence imaging. From a bright-field image, the physical characteristics of cells can be discerned — size, shape, opacity, granularity, elasticity, and so on. On the other hand, a fluorescence image is used to identify both the type and distribution of key biomarkers present in each cell. (Figure 2: Illustration of prototypical data from image cytometry. Image from GEN )

High-Speed Image Cytometry

Capturing image-cytometry data at exceedingly high-speeds brings about new physical challenges. Firstly, cells that move rapidly within the microchannel demand sensors capable of ultra-short exposure times (on the order of microseconds). This is necessary to eliminate image blur — an imaging artifact that occurs when an object moves far during image capture (or during exposure times). Unfortunately, having short exposure times brings about another imaging challenge. The short exposure times limit the ability to collect enough light to generate high-quality images of low-light events (i.e., fluorescence). Typically, for tagged cells, the emitted signal is relatively low for millisecond camera exposure times. In addition, when excited, tagged cells emit isotopically and thus the number of photons available for image formation drops off by the inverse square law. These facts make it specifically difficult, or in some cases even impossible, for fluorescence imaging applications that demand frame rates on the order of one to two thousand frames-per-second and beyond. Currently, the strategy to achieve higher speeds is to couple the camera with an image intensifier. In addition, there are also commercial intensified sCMOS sensors (i.e., from PCO) capable of 100 to 7000 frames/s at full and reduced resolution, respectively. One of the key features in these systems is the low 1.1 e- readout noise. 

Where fluorescence imaging is a challenge at high frame rates and low exposure times, bright-field imaging is limited by speeds of the CMOS sensor. This is due to the fact that backlighting provides enough light for good illumination even with sub-microsecond exposure times, and frame rates can possibly exceed 1 million frames per second. 

Machine Vision Applied to Biomedicine

90% of all medical data is now image-based. An increased need for automation and a growing demand for vision-based systems are driving large-scale adoption within the healthcare community.

Image cytometry — high-speed single-cell imaging — is proving effective for large-scale single-cell analysis because of its ability to improve the accuracy of phenotypic identification while preserving the native characteristics of the cell sample.

Once cells are identified and segregated, a considerable number of quantitative metrics can be collected to create unique morphological profiles. Similarities between profiles can then be correlated to define new subpopulations or to identify phenotypes specific to certain diseases. This kind of automation can shorten the time between sample and diagnosis.

Take sepsis for example, an infection that is the #1 cause of death in U.S. hospitals. Eighty percent of sepsis related deaths could be prevented through more rapid diagnosis and treatment. Emergency Room physicians employ a series of lab tests, X-rays, CT scans, or MRIs to pinpoint the location of the infection, but accurate analysis takes time.

Using image cytometry, researchers can reduce time to diagnosis by measuring shifts in the biomechanical properties of immune cells. Using granulocyte deformability as the distinguishing phenotypic biomarker between blood samples from patients with sepsis and healthy donors. Correlated characteristics led to the creation of an “expression profile” that could be compared to new patient samples and render test results in less than ten minutes (Our infograph explains the image cytometry workflow.)

Phantom Camera Leads the Way

Vision Research has designed machine vision cameras to meet the needs of image cytometry engineers. For image cytometry to achieve optimal results, high-speed cameras with larger pixels — typically between 10 to 30 microns in edge — are required. In a typical cytometry experiment, frame rates as high as 10,000 frames per second are commonplace. Furthermore, better image quality (selectable bit depths from 8, 10, and 12) coupled with higher light sensitivity leads to the capture of significantly higher quality image data. Most notably, Phantom machine vision cameras are the fastest machine vision cameras in the world, capable of streaming off upwards of 9 gigapixels of image data per second to media that can store upwards of 22 TB and beyond. Figure 3, shows typical image cytometry data, where a cell is traveling rapidly through a microchannel.  The camera was able to capture the size, shape, rotational speed, and even resolve some of the internal details of the cell. This experiment was performed with the Phantom S990 machine vision camera.  

Image cytometry also requires automated identification of cellular phenotypes, else the technology becomes limited in its scope of potential benefits. This need prompted the development of new software designed to work with high-speed imaging. 

In a recent experiment, Kyle Gilroy, PhD of Vision Research developed a ‘model’ system consisting polystyrene microspheres (diameter = 25 μm) flowing through a microfluidic channel at high speeds. A Phantom S640 machine vision camera was used to monitor the rapid microsphere movement as they traversed the channel (camera speeds at 3300 frames per second). Then, software developed by Marco Gajardo and Mikael Brommels of Spicatek was used to rapidly analyze this data for the extraction of key phenotypic data. An example of typical data can be seen in Figure 4. Most remarkably, the image analysis could be performed and the resulting data reported to the user before the next frame was captured.

CAMERAS